Standard deviation calculator assists to compute the standard deviation from a given set of numerical values. It is a tool that has the capacity to show mean, variance and standard deviation for the shared data/information.
In short, it is considered best statistical tool to compute standard deviation from a set of observation/population or from sample.
Note: Please enter comma separated values e.g. 12, 20, 30, 15
What is Standard Deviation?
The standard deviation is a measure that indicates how much data scattered around the mean or a measure of dispersion or variation of a set of data values. Denoted by lower cases, Greek word sigma σ, SD or S.
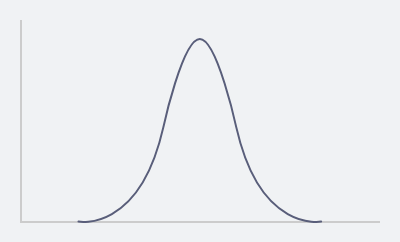
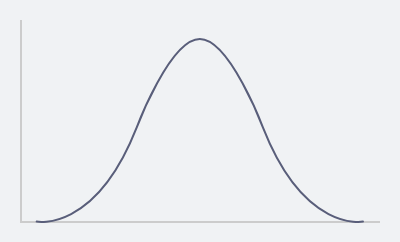
A low standard deviation indicates that data are tightly clustered around the mean deviation indicates the data are widely dispersed.
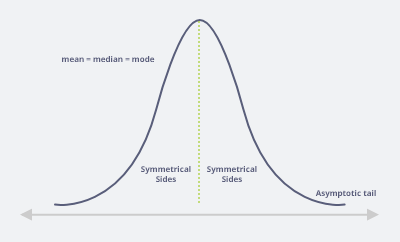
Normal Distribution
Mean = Median = Mode
How to Calculate Standard Deviation?
For calculating standard deviation first find mean,
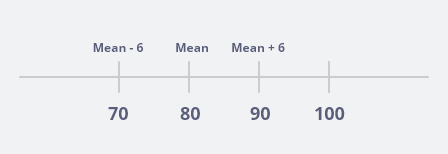
\(Mean = \dfrac{Summation}{No.of observation} = \dfrac{73 + 73 + 76 + 77 + 81 + 100}{6} = \dfrac{480}{6} = 80\)
\(SD = \sqrt{\dfrac{∑(x-x̄)^2}{N}}\)
∑ = Summation
x̄ = Mean
N = No. of observations
\( SD = \sqrt{\dfrac{∑(x-x̄)^2}{N}}\)
\( SD = \sqrt{\dfrac{∑(x_1-x̄)^2 + ∑(x_2-x̄)^2 +…∑(x_n-x̄)^2}{N}}\)
\( SD = \sqrt{\dfrac{∑(73.80)^2 + (73-80)^2 + (76-80)^2 + (77-80)^2 + (81-80)^2 + (100-80)^2}{6}}\)
\( SD = \sqrt{\dfrac{524}{6}}\)
\( SD = 9.3\)
So, S.D is 9.3 units.
What does the standard deviation tell us?
It is a measure of dispersion, it measures how spread out the data from the mean. The further the data, the greater the standard deviation. A standard deviation of zero indicates all values in the set are the same. In our example
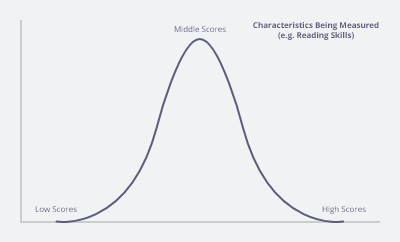
The standard deviation describes how close to the mean the individual student reading scores are?
If the standard deviation is small then
Most students have achieved close to the average score with few achieving high or low score.
If the standard deviation is larger then
The students scores are very spread out from the mean with individual achieving very high or very low score on the reading skill test.
Why is standard deviation useful or why do we need to calculate standard deviation?
We can easily understand it by sharing an example.
Example:
A teacher wanted to compare the performance of girls and boys in a class test, both genders had a mean score 50% but we need to be e careful in conducting that there was no difference between the genders.
For girls S.D. is 5.6
For boys S.D. 15.2
As the standard deviation is much higher for the boys so, their scores are far more spread out from the mean (50%) with scores being much higher and much lower than average.
The girls had a smaller standard deviation so, their scores are much closer to the average of 50 person which means most girls achieve close to 50% on the test.
Conclusion:
Standard deviation measures the spread of data from the mean. If the S.D is LARGER participant scores are FAR AWAY from the mean.
If the S.D is SMALL participant scores are CLOSE to mean.
Population standard deviation
Example: Let’s take a data for proper understanding.
Let x= {3, 5, 7, 17}
Here, n=4,
\(x = 8\),
\(σ = ?\)
By applying standard deviation formula,
\(σ = \sqrt{\dfrac{∑(x-x̄)^2}{N}}\)
| \(x – x̄\) |
\((x – x̄)^2\) |
| \(3 – 8 = -5\) |
\((-5)^2 = 25\) |
| \(5 – 8 = -3\) |
\((-3)^2 = 9\) |
| \(7 – 8 = -1\) |
\((-1)^2 = 1\) |
| \(17 – 8 = 9\) |
\((9)^2 = 81\) |
Hence, \(∑(x-x̄)^2 = 116\)
Substitute this value in population S.D formula. “σ” is known as population S.D.
\(σ = \sqrt{\dfrac{∑(x-x̄)^2}{N}} = \sqrt{\dfrac{116}{4}} = \sqrt{29} = 5.39 \)
So, the population S.D of the given data is 5.39 units which is a typical deviate figure from the shared mean.
| Standard Deviation (Notations) |
| Population |
Sample |
| σ |
S |
| Sigma |
“s” |
FAQS
Q1: What is standard deviation?
Answer: The standard deviation is the measures of dispersion or spread of data about the mean value.
Q2: How do we calculate standard deviation?
Answer: For” n“ number of observations in a given sample, first find out the mean and then differences in mean for each given data and then square the differences after this sum up all the values and then divide it by shared mean and then taking square root.
Q3: How does standard deviation affect data?
Answer: Standard deviation measures the spread of a data distribution. The more spread out data distribution is, the greater its standard deviation. Standard deviation cannot be negative. A standard deviation close to zero indicates that the data points tend to be close to the mean.
Q4: Does standard deviation increase with sample size?
Answer: The population mean of the distribution of sample means is the same as the population mean of the distribution. Thus, the sample size increases the standard deviation of the mean decreases.
Q5: How standard deviation is used in business?
Answer: In statistical world the standard deviation measures how much individual data points vary from the mean. In business it helps to calculate the margins of error in the sample survey. The gaining value is how far or close to expected one. Last but not least it is the ideal indicator in price mechanism.
Q6: Can standard deviation be greater than mean?
Answer: Absolutely true, the standard deviation can be greater than the mean.
Q7: What is the reason behind a large standard deviation?
Answer: A larger standard deviation indicates that the data points are far from the mean.
Q8: What standard deviation tells us in research?
Answer: The standard deviation is the average amount of variability in our data set. It tells us, on average, how far each score lies from the mean.
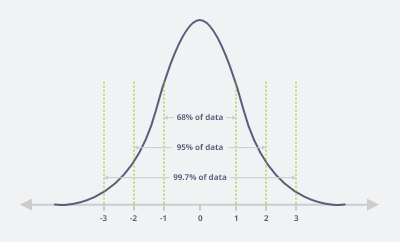
Q9: What is the empirical rule of the standard deviation?
Answer: The 68-95-99.7 tell us where most of the values lies in a normal distribution.
Q10: What is a reliable is standard deviation?
Answer: Standard deviation is a mathematical/statistical tool to help us assess how far the values are spread above or below the mean. A high standard and shows that the data is widely spread (less reliable) and low standard deviation shows that the data are clustered closely around the mean (more reliable).